In This Chapter
▶ Creating a map of the process
Painting a picture of the process
When trying to understand your processes and how the work gets done, the phrase 'a picture paints a thousand words' is certainly true. In this section, we look at two specific options for painting that picture of your process - a deployment flowchart and a value stream map. Despite their names, both of them are process maps, and we tend to use the term process map in this section.
When you paint the picture of your process, keep in mind why you are doing it. Developing the picture helps you understand how the work gets done and the degree of complexity in the process. You're not painting this particular picture as the specification for a computer system change, so keep things simple. You're drawing a 'current states' picture to see how things are done now.
Your picture can provide a useful framework that prompts a whole range of questions:
- Who are the customers that have expectations of the process?
- Why is the process done? What is its purpose? Does everyone involved understand the purpose?
- What are the value-added and non-value-added steps?
- How can you carry out essential non-value-added steps using minimal resources?
- What are the critical success factors - that is, the things you must do well?
- Why is the process done when it is done?
- Why are tasks in the process carried out in that order? Are all the steps involved in the process necessary? Do all the steps add value for the customer?
- Why is the process carried out by a particular person or people?
- What measure is in place to assess the performance and identify possible improvement opportunities? Think in particular of how you might identify and measure those parts of the process that are repetitive and important to ensuring the process conforms to requirements.
- What is the cycle time involved in the process? Why is the cycle time longer than the unit time?
- What are the barriers that prevent the supplier from producing a quality output?
- If decisions need to be made as part of the process, are the criteria that will be used to make the decision understood by everyone involved? Are the decisions communicated adequately? Are the authority limits appropriate?
- How do you and others deal with problems that occur in the process?
- What are the most common mistakes that occur in the process?
- What impact do these mistakes have on customers?
- Where has the improvement already been tried in the process? What were the outcomes?
※ Whichever questions you ask, don't forget to keep asking 'why?'
Keeping things simple
Process mapping uses lots of different symbols, or conventions; try to use as few as possible. To create a deployment flowchart, which we talk about in the next section, just two or three conventions are usually enough: the circle, the square box, and the diamond, as shown in the below figure.
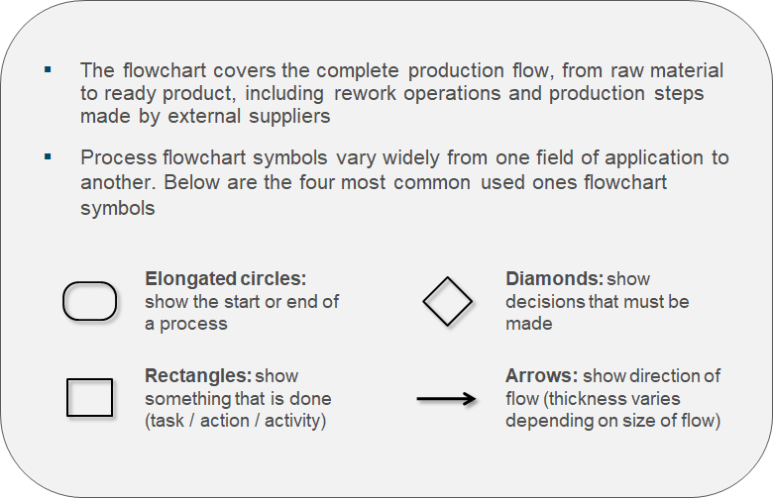
Keeping it simple with process mapping symbols. Keeping the whole picture is vital.
Developing a deployment flowchart
The deployment flowchart builds on the high-level SIPOC diagram described in the previous Chapter, and goes into more detail, but not too much. The flowchart identifies who's involved in the process and what they do, including a different member of a team who is involved in different steps in the process, and also other teams and departments, the internal customers and suppliers.
Spotting moment of truth is easier when using a deployment flowchart. Moments of truth are touchpoints with the customer (when a customer comes into contact with a company).
Before you begin working on a deployment flowchart, make sure you have an objective of the process that reflects the CTQs(Critical To Quality). And make sure you can answer the question, 'why are you doing this process?'
Involve the people who work in the process when you develop a deployment flowchart. Because different perceptions exist of how the process works, use a sticky note for each step in the process so that you move things around simply. You may well discover that the process is more complex than you think it is, which is why carrying out a process stapling exercise first can be so useful.
In the previous posting linked below, we introduce A, B and C's process stapling in action. (#6 업무의 흐름 파악하기 Part 1 - Determining the Chain of Events)
Now let's call A, B and C as below:
· A = Ann
· B = Brian
· C = Clare
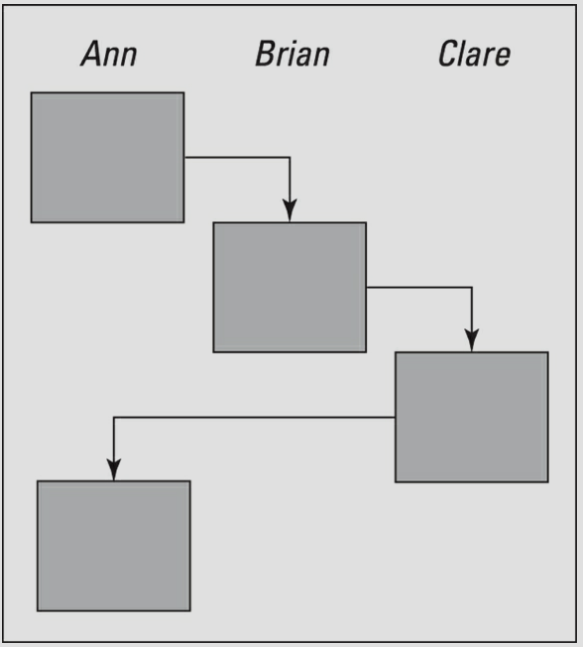
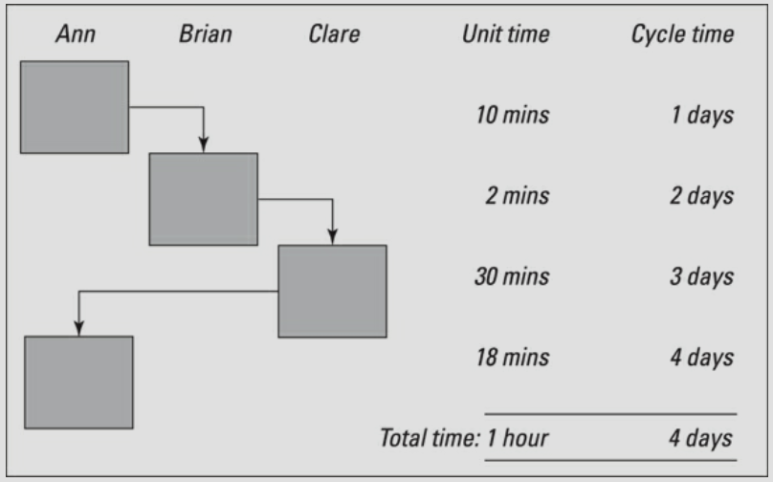
We use the same example, beginning with the below figure when we develop our map. Each time a different person or another area in the workplace is involved, the chart moves horizontally and down. Operations that occur simultaneously are shown on the same level.
These charts usually have vertical lines between the different people and are often referred to as 'swimming lane' charts. Every time a flow arrow crosses a dividing line, you should consider taking a measurement.
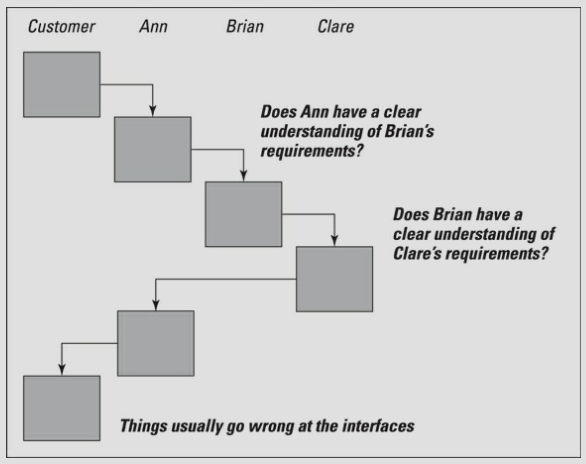
Most problems occur at the interface between two people or two departments, for example between Ann and Brian. Measures are almost certainly necessary here to help monitor performance and identify if problems exist, perhaps caused by misunderstanding the requirements.
In the below figure you are simply measuring unit time - the time it takes to complete this step.
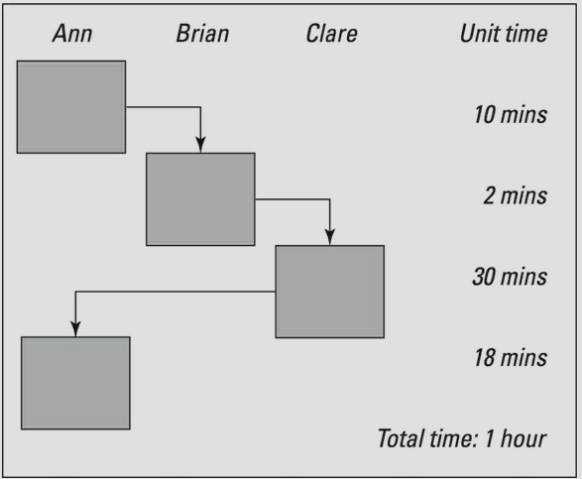
While this measurement could prompt some interesting questions, viewing a bigger picture is more helpful as it also includes the elapsed or cycle time. This measurement is the time it takes to complete the entire process.
Building in the cycle time helps you identify bottlenecks and dead time - so-called because from the customer's perspective nothing's happening. In the below figure, step number two is causing a bottleneck. If Brian's step can possibly be removed from the process, and Ann or Clare takes up Brian's work, you may be able to halve the cycle time. Possibly Brian's step is a non-valve-adding step and isn't needed at all.
In your processes, try to identify and manage bottlenecks, ask questions that clarify your understanding, and always look for improvement opportunities. Earlier in this section, we listed some typical questions that your process picture may prompt.
※ 참조: 본문은 책, "Dummy들을 위한 린 식스시그마(Lean Six Sigma)"와 The Toyota way를 정리한 내용을 기반으로 제 경험들을 조미한 글입니다. 현재는 원서 기반으로 내용을 정리하고 있는 중이며, 정리가 완료되면 한글로 번역을 추가할 예정입니다.


