A value stream map is either an additional or an alternative to the deployment flowchart as a way of looking at how work gets done in your organization.
The term 'value stream' is a misleading description. The value stream map shows all the tasks, both value-creating and non-value-creating, which take your product from concept to launch or from order to delivery, for example. These actions include steps to process information from the customer and steps to transform the product on its way to the customer.
Toyota's Taiichi Ohno summarized the value steam nicely in 1978 when he said:
"All we are doing is looking at a timeline from the moment the customer gives us an order to the point when we collect the cash. And we are reducing that timeline by removing the non-value-added wastes."
Ideally, your process map includes the external customer. You need to recognize and understand the whole process or system and to spot the moments of truth.
Process stapling is an ideal first step to help you create a value stream map and you really do need to go to the Gemba to see what's happening. For the low-down on this concepts, check out the 'Genning up on the Gemba' sidebar and the 'Practising process stapling' section in the below link:
#6 업무의 흐름 파악하기 Part 1 - Determining the Chain of Events
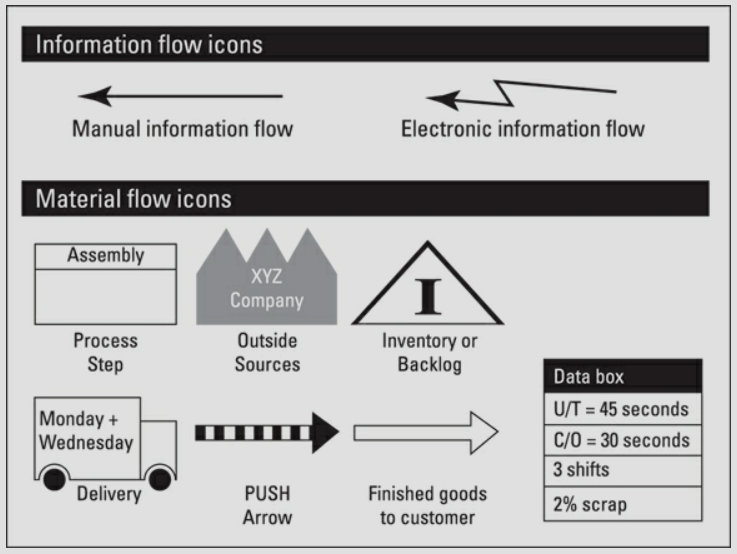
For creating a value stream map, a selection of more commonly used conventions is shown in the below figure.
To draw your value stream map, work through the following steps:
1. Identify the process you want to look at, agreeing on the start and stop points.
Describing the product and service this process is supporting is also helpful.
2. Set up a small team to do the analysis.
The team should have knowledge of all the steps involved, from supplier input to an external customer, so it must include the people working in the process.
3. Go to the Gemba
Go where the action is and watch what actually happens. Value stream map starts in the workplace.
4. Working at a reasonably high level, draw a process map of the material/product flow in the whole
value stream.
Some people prefer to do this exercise starting at the customer end and working backward - rather like process stapling in reverse. Write down the steps as you go, rather than trying to remember everything. As well as material and product flow, remember to capture the information flow that causes the product or material to move through the process.
5. Identify the performance data you'd like to know.
Useful information often includes activity or unit time, cycle time, scrap or rework rates, the number of staff/resources, batch sizes, machine time, changeover time, working time, inventory, and backlog.
※ In the next chapter, we will explore the above data. e.g., unit time, cycle time, Takt time, etc
6. Collect the data you need for each step in the process.
Add the data to your map in boxes. For example, in the above figure 'Value stream map conventions', you can see a data box capturing a range of information, including unit time (U/T = 45 seconds)
The 'C/O = 30 minutes' entry refers to change over time. This is when it takes to set up equipment to move processing one type of product to another or close one system and open another. A focus on reducing changeover time was one of the keys to success for Toyota in gaining market share over many of the Westen car manufacturers, where it was referred to SMED - Single Minutes Exchange of Die (die are the casts and molds in the production system). In the spirit of continuous improvement, Toyota still looks to reduce changeover times.
▶ A Real Story
Working as a consultant in Toyota, Shigeo Shingo believed the company could make huge gains if changeovers could be actioned more quickly. He set a target to reduce any set-up time by 59/60ths. Shingo felt that many companies had policies designed to raise their workers' skill level, but few had implemented strategies to lower the skill level required by the set-up itself.
7. Add arrows to show information flows.
The value stream map shows information flow as well as material flow, separately identifying whether the information is sent manually or electronically (refer to the above figure showing the conventions). The value stream map shows the information flow in the top half of the map, with the material flow below.
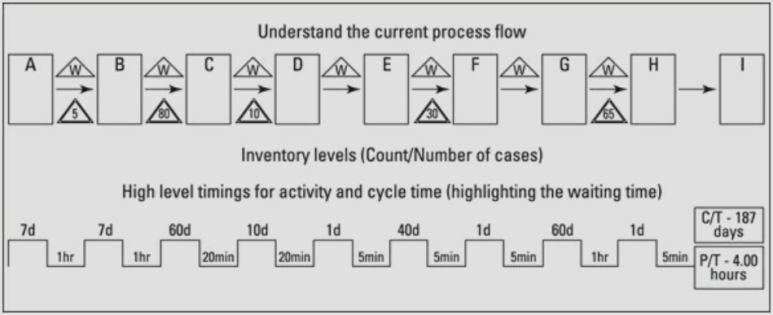
8. Add an overall timeline to show the average cycle time for an item.
This timeline shows how long the item spends in the whole process. The below figure identifies the process step A to I and indicates cycle times and unit times (I will explain the difference between cycle time and unit time in the next section) and the levels of work in progress or inventory identified in the triangles between the steps.
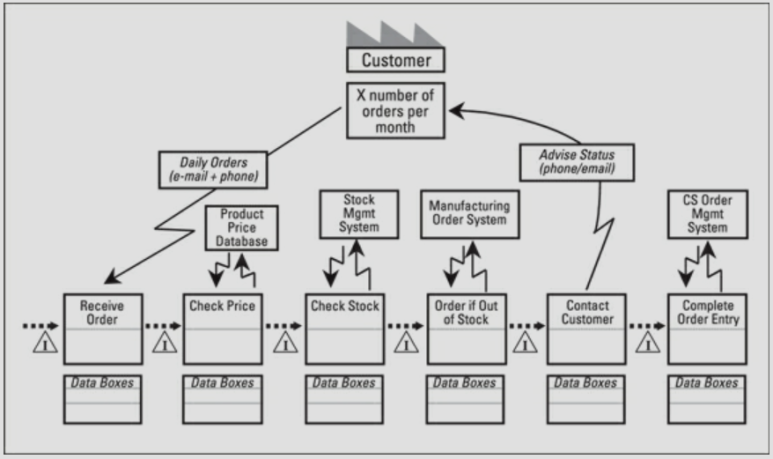
▶ Exercise: As an example of a value stream map, consider ABC company's order process. The process begins with a customer service receiving an email or telephone order. The product price is checked using the product price database.
Availability is checked in terms of stock inventory using the stock inventory management system. If inventory cannot be allocated, the order is passed to the manufacturing team through the manufacturing order system and scheduled for production the next day.
The delivery date is determined, the customer is advised and the order entry records are completed through the customer service order management system. The 'current state' picture of the value stream will resemble that shown in the below figure.
Using average is usually fine, but do recognize the danger of using averages and remember that the actual times vary either side of the mean - known in the scary worlds of statistics and mathematics as 'variation'.
In the ABC example, the current state map includes some triangles containing the letter 'i'. These triangles are for the level of inventory or work in progress.
When you create a value stream map for one of your processes, you need to remember that the map describes the current state of your organization - a snapshot in time. Whether people in your organization feel the inventory isn't usually that high or low isn't relevant; for whatever reason, the inventory is what it is right now.
In order to have a complete view of things, you need to incorporate data such as activity time and cycle time and change over time.
The following example of a value stream map in a service organization demonstrates how valuable the addition of data becomes. It enables you to not only see how the work gets done but also how well it gets done.
The next few pages focus on a bank example and the creation of the value stream map for the loan application process.
The loan team already had a developed SIPOC diagram(refer to the previous section). #3 당신의 고객은 누구인가? - Identifying Your Customers
But they weren't sure that it was entirely accurate. So, the first step in this instance was for them to understand how the work gets done by carrying out a process stapling exercise. In doing so, they took note of work- i- progress levels ('i' in the triangles, see the above conventions), and they created a current state map step by step.
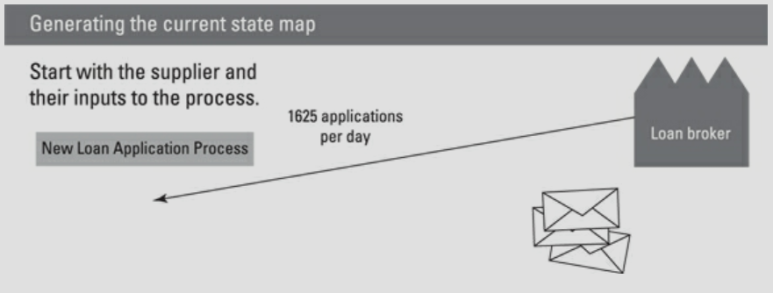
The loan applications are sent into the company by loan brokers acting on behalf of individuals. You can see 1625 applications have been received on this particular day.
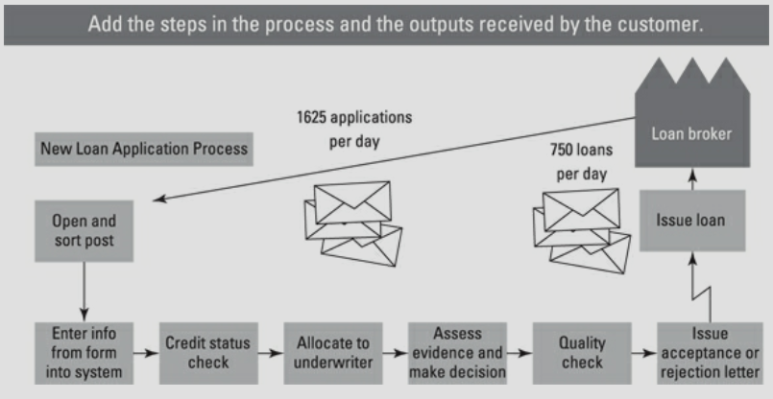
In many ways, this picture is similar to the SIPOC, but it lacks information about who all the different customers and suppliers are(both internal and external), and the associated inputs and outputs. Having this picture, it's time to add in some data, as shown in the below picture.
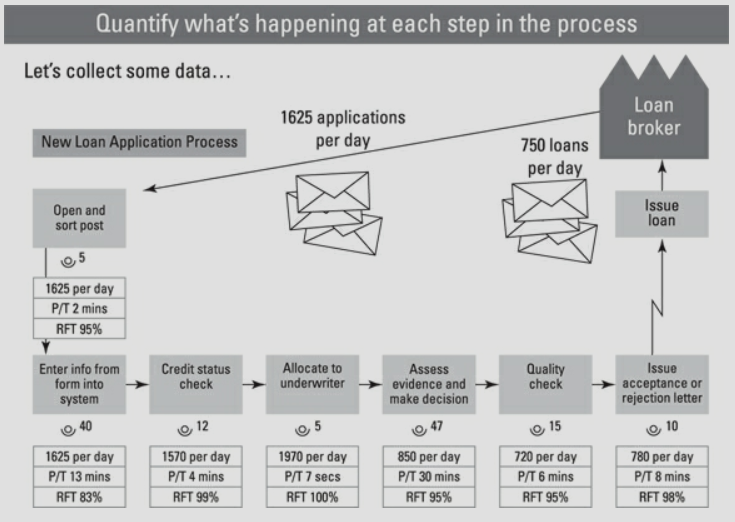
We're beginning to create a detailed picture of what's happening in this process. The data shows the number of people working on each step, work volumes, and the levels of accuracy. Already we can see opportunities for improvement through the reduction of errors.
The symbol and the number alongside it indicate the number of people working at that process step. The data box holds the information you decide is important. In this case, the bank has included the number of items received each day, the processing time(P/T), and the percentage 'Right First Time'(RTF). You might have wanted other information, for example, the change-over-time or productivity details.
Either way, you can see there's scope for reducing errors, especially in the 'enter info form into system' step, where the error rate is 17 percent.
This high error rate would be a problem anywhere in the process, but at such an early stage is likely to lead to delays for the customer, particularly if the errors aren't picked up straight away. And think about the cost, too.
By building in the work-in-progress information, we're getting clues about the backlogs and bottlenecks, and the dangers inherent in a 'push system' are becoming obvious.
In the below figure, the work-in-progress figures - the numbers alongside the triangle - confirm the delays in the process and help highlight the areas that need addressing. The bottlenecks need to be managed, or you'll find that they manage you and your process.
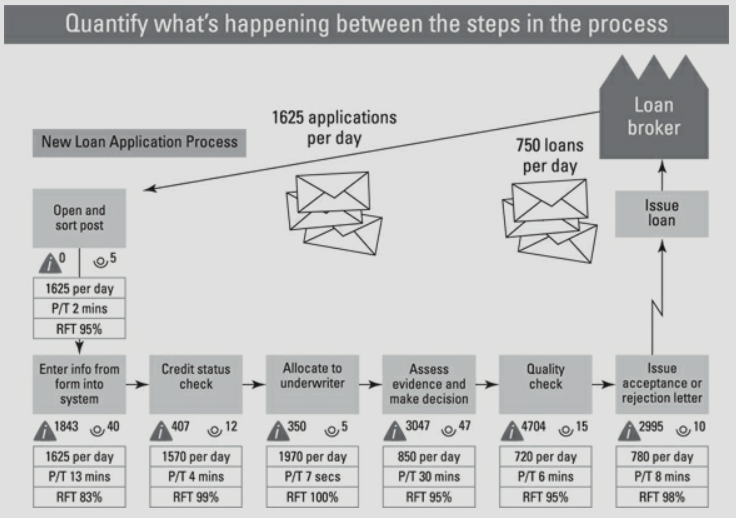
You can see that for 4704 items the quality check step is seriously behind, but issues are evident throughout the process, something the addition of a timeline will further confirm.
The timeline shown in the below figure enables us to focus on the bottlenecks - the difference between the processing time and the cycle time is dead time, and we can see some significant issues that could be addressed by applying the theory of constraints. As you can see, the overall process is taking almost 30 days to complete, but an individual case could be processed in just over an hour.
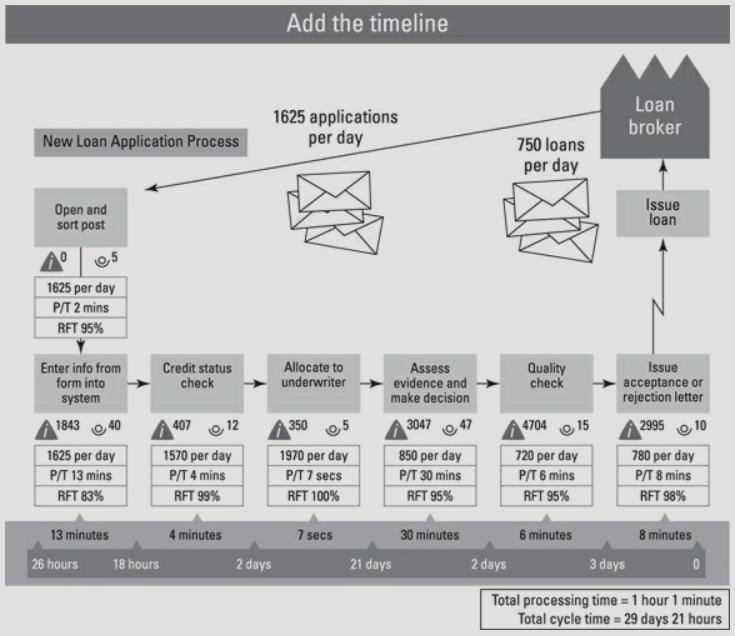
The timeline information will also help you identify whether the line needs to be better balanced. And, of course, if you then determine Takt time, you can assess the staffing levels needed to deal with the customer volumes.
Clearly, improvement opportunities exist, and the next step is to highlight these on a value stream map.
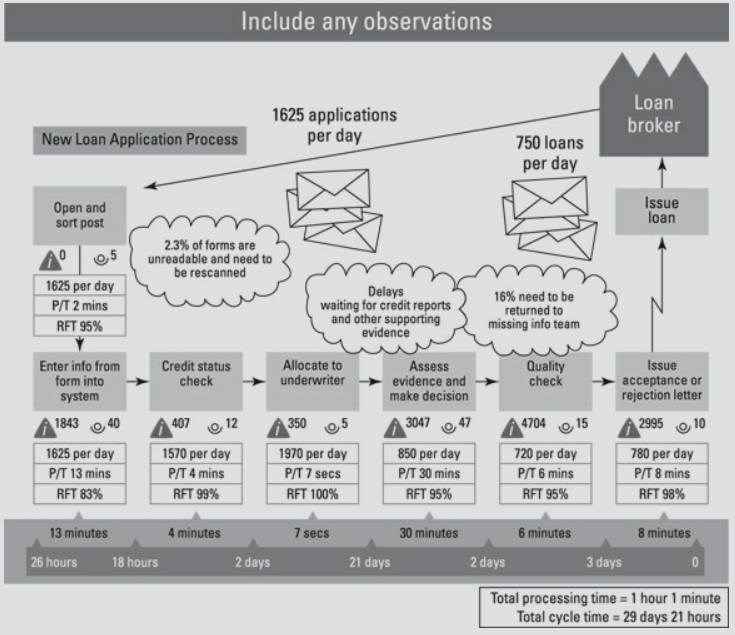
A selection of opportunities and observations are included in the above figure. Apart from tacking the bottlenecks, non-value-adding steps may exist that can be removed, or perhaps people and equipment could be relocated into a more efficiently laid out workspace as I gave an example in the previous section '업무의 흐름 파악하기 Part 1 - Determining the Chain of Event' linked below. #6 업무의 흐름 파악하기 Part 1 - Determining the Chain of Events
#6 업무의 흐름 파악하기 Part 1 - Determining the Chain of Events
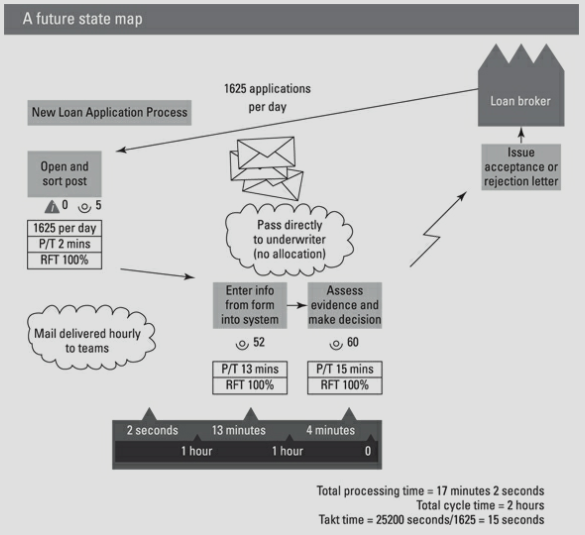
The improvement ideas or objectives could be added to the map for further review and prioritization and this could help you develop a future state map as shown in the below figure.
Tip] Developing a picture of your process, using a deployment flowchart and/or a value stream map will also help you identify the moments of truth.
REAL STORY> Jan Carlzon, one-time chief executive of Scandinavian Air Service(SAS), developed and popularized the concept of moments of truth in his book of the same name. He informed all SAS staff that the organization needs to improve by 1,000 percent! He asked his staff to improve 1000 things by 1 percent and then to keep doing it. He wanted them to focus on the customer contacts - the moment of truth - such as booking a ticket, checking in, or boarding a plane.
Carlzon used an example of a passenger pulling down the meal tray. If the tray was dirty, what would the customer think? What might that tell the customer about the maintenance of the plane?
To achieve what your customer wants, you need to understand the many moments of truth opportunities that exist and find ways of enhancing the customer's experience. Process stapling, deployment flowcharts and value steam maps can help you identify both internal and external customer touchpoints.
※ 참조: 본문은 책, "Dummy들을 위한 린 식스시그마(Lean Six Sigma)"와 The Toyota way를 정리한 내용을 기반으로 제 경험들을 조미한 글입니다. 현재는 원서 기반으로 내용을 정리하고 있는 중이며, 정리가 완료되면 한글로 번역을 추가할 예정입니다.
'Lean Six Sigma' 카테고리의 다른 글
| #10 필요한 정보 모으기 - Gathering Information (0) | 2021.03.27 |
|---|---|
| #9 Takt time, Cycle time, Processing time 구별하기 - Defining the different times (0) | 2021.03.27 |
| #7 업무의 흐름 파악하기 Part 2 - Determining the Chain of Events (0) | 2021.03.27 |
| #6 업무의 흐름 파악하기 Part 1 - Determining the Chain of Events (0) | 2021.03.27 |
| #5 고객의 니즈(Needs) 파악하기 Part 2 - Understanding Your Customers' Needs (0) | 2021.03.27 |


